• Our new ticketing site is now live! Using either this or the original site (both powered by TrainSplit) helps support the running of the forum with every ticket purchase! Find out more and ask any questions/give us feedback in this thread!

EC onboard map

Status
Not open for further replies.
Sponsor Post - registered members do not see these adverts; click here to register, or click here to log in
R

RailUK Forums

dbrb2

Member
Joined
29 May 2011
Messages
50
Does the wifi homepage on the virgin train have any kind of map already?

If it does it would almost certainly be possible to modify my code to make use of it...?
 

AlterEgo

Verified Rep - Wingin' It! Paul Lucas
Joined
30 Dec 2008
Messages
29,187
Location
LBK
Can I use this map on my FGW trip from Paddington to Swansea?
 

yorkie

Forum Staff
Staff Member
Administrator
Joined
6 Jun 2005
Messages
78,197
Location
Yorkshire
I'm using it now on the 1450 ABD-DON, the location is accurate but the speed is about half the correct speed, it says we are doing 46mph and we are probably doing 90+
 

MCR247

Established Member
Joined
7 Nov 2008
Messages
10,290
This is a tricky one to fix - but I know the cause.

If you are on a train, then the onboard device reports your position in m/s

If you are not, then the data is returned in knots - and the conversions are obviously different to mph

I think I have put in a programmatic fix - though it will break if the onboard system ever switches back to knots!

Try it now :)

Ben

Looks like the same problem?
 

ainsworth74

Forum Staff
Staff Member
Global Moderator
Joined
16 Nov 2009
Messages
31,068
Location
Redcar
I'm using it now on the 1450 ABD-DON, the location is accurate but the speed is about half the correct speed, it says we are doing 46mph and we are probably doing 90+

It's a known issue it's reporting the speed in m/s rather than mph I think the OP is working on it.
 
Last edited:

dbrb2

Member
Joined
29 May 2011
Messages
50
Doh! I thought I had that one sorted

The problem is that onbboard and offboard speeds are reported using different units, and working out which conversion to use is tricky.

If you are still on the train, and can post a copy of what you see at this url:

https://www.ombord.info/api/xml/connectivity/

and this one...

https://www.ombord.info/api/xml/system

Then I can probably find out what the problem is :)

In the meantime, I have tried another fix which may do the job...
Cheers,

Ben
 
Last edited:

yorkie

Forum Staff
Staff Member
Administrator
Joined
6 Jun 2005
Messages
78,197
Location
Yorkshire
Both say "404 - Not Found"

But if I use http rather than https I get:

<connectivity><online type="integer">1</online><links type="array"><link><index type="integer">2</index><device_type type="string">ethernet</device_type><device_subtype type="string">unavailable</device_subtype><device_state type="string">down</device_state><link_state type="string">disconnected</link_state><rssi type="integer">-1</rssi><technology type="string">unavailable</technology><operator_id type="integer">-1</operator_id></link><link><index type="integer">101</index><device_type type="string">modem</device_type><device_subtype type="string">sierra-8780</device_subtype><device_state type="string">up</device_state><link_state type="string">available</link_state><rssi type="integer">-51</rssi><technology type="string">hspa</technology><operator_id type="integer">23415</operator_id><umts_info><net_status type="integer">1</net_status><lac type="string">0000</lac><cellid type="string">00000000</cellid></umts_info></link><link><index type="integer">103</index><device_type type="string">modem</device_type><device_subtype type="string">sierra-8780</device_subtype><device_state type="string">up</device_state><link_state type="string">available</link_state><rssi type="integer">-94</rssi><technology type="string">hspa</technology><operator_id type="integer">23433</operator_id><umts_info><net_status type="integer">1</net_status><lac type="string">0000</lac><cellid type="string">00000000</cellid></umts_info></link><link><index type="integer">201</index><device_type type="string">modem</device_type><device_subtype type="string">sierra-8780</device_subtype><device_state type="string">up</device_state><link_state type="string">available</link_state><rssi type="integer">-59</rssi><technology type="string">gprs</technology><operator_id type="integer">23410</operator_id><umts_info><net_status type="integer">1</net_status><lac type="string">0000</lac><cellid type="string">00000000</cellid></umts_info></link><link><index type="integer">202</index><device_type type="string">modem</device_type><device_subtype type="string">sierra-8780</device_subtype><device_state type="string">up</device_state><link_state type="string">available</link_state><rssi type="integer">-78</rssi><technology type="string">hspa</technology><operator_id type="integer">23420</operator_id><umts_info><net_status type="integer">1</net_status><lac type="string">0000</lac><cellid type="string">00000000</cellid></umts_info></link></links></connectivity>

and

<system><system_id type="integer">1157</system_id></system>


Will check the speed when we get moving again, currently stuck behind a Northern train.
 

dbrb2

Member
Joined
29 May 2011
Messages
50
Ah yes - sorry about that. That https mismatch /may/ have been why my original fix was failing...
 

OxtedL

Established Member
Associate Staff
Quizmaster
Joined
23 Mar 2011
Messages
2,631
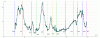
So having worked out where the data feed was but not having the skill required to do something as snazzy as dbrb2's map, I have been testing some data logging ideas for an entirely unrelated project. Hence a sudden graph... :D

Does this look about right for a height profile of the ECML? Obviously the GPS doesn't cope too well with being in tunnels or buildings, but otherwise OK?
 

Attachments

  • ECML profile.gif
    ECML profile.gif
    41 KB · Views: 49

OxtedL

Established Member
Associate Staff
Quizmaster
Joined
23 Mar 2011
Messages
2,631
It's not my fault that the train hasn't been to Edinburgh this weekend! :D
 

LNW-GW Joint

Veteran Member
Joined
22 Feb 2011
Messages
21,898
Location
Mold, Clwyd
So having worked out where the data feed was but not having the skill required to do something as snazzy as dbrb2's map, I have been testing some data logging ideas for an entirely unrelated project. Hence a sudden graph... :D

Does this look about right for a height profile of the ECML? Obviously the GPS doesn't cope too well with being in tunnels or buildings, but otherwise OK?

Very nice. Makes Stoke Summit look like Shap...
Be nice to mark the rivers - have you noticed the Google map doesn't name any? The most prominent landmarks it shows on the ECML route are golf courses!
 

DaveNewcastle

Established Member
Joined
21 Dec 2007
Messages
7,387
Location
Newcastle (unless I'm out)
Does this look about right for a height profile of the ECML?
Very good! I'm intrigued.

There's a couple of sections which don't seem quite correct, but I'm relying on memory and you're relying on technology, so not a fair comparison!

Is the run through Holme Fen really no lower than 10mtrs? I'm sure it reaches close to sea-level with the surface of the peat on the Fen having fallen to 2 - 3 mtrs below sea.

I'm also curious about the Stoke profile, I have Essendine at 25mtrs and didn't think that the 1/200 northbound climb began until north of Careby.

Then isn't there a slight climb north out of Grantham towards the south portal of Peascliffe Tunnel at 65mtrs?

North of Donny, doesn't Shaftholm Jn appear in a low plain at about 7mtrs, with Templehurst and Hambleton Jns also at only 6 - 8 mtrs?

And as for Newcastle, just how come it has risen to 48mtrs above sea level?

But despite these questions, I'm very impressed and admire your work in developing this profile.
It points out the acute gradients in some of the less-well known areas, such as the climb from New Southgate to Potters Bar and the drop from Stevenage to Hitchin!

Nice work.
 
Last edited:

OxtedL

Established Member
Associate Staff
Quizmaster
Joined
23 Mar 2011
Messages
2,631
Having compared it to the Google Earth profile it does seem slightly suspect, so can't say if it's accurate... :D Reflecting on this, I think it's worth noting that:
  • The graph is plotted against Latitude and not against distance along the ECML, which I haven't worked out as that would require trigonometry and that would just be too exciting for me to cope. :roll: :lol:
  • The Altitude recorded by the GPS seems to be affected by the speed.
  • I have idea what the units of Altitude being used actually are. If it's GPS then feet wouldn't surprise me, but I genuinely don't know. :D
  • Whenever there were any tunnels or buildings whatsoever the data has had a bit of a hiccup. This is most noticeable around KGX, York and Darlington, and is probably what happened at York.
Hope that helps. If there are any problems, they are not my fault! :)
 

DaveNewcastle

Established Member
Joined
21 Dec 2007
Messages
7,387
Location
Newcastle (unless I'm out)
If there are any problems, they are not my fault! :)
The thought never entered my head!

I don't think the latitude / distance issue is too bothersome, because I wasn't trying to extrapolate gradients. If you wanted, there's a quick and dirty solution by plotting the horizontal axis as the Northling plus the Eastling (where both of these are always the difference between the current location and the previous location, with negatives converted to positive, and then added to the previous location) so you'd get a closer approximation of distance irrespective of direction.

The units of altitude are surely meters, because they are accurate for so many locations, esp the stations which you've marked, all in meters above sea level.

However, the lowest points on the ECML are sometimes below 10mtrs as I listed above, so that limit of 10 mtrs is a puzzle (perhaps its the height of a sensor on the roof - that adds 3 meters straight away!

Don't know if you have the chance or inclination, but it would be good to record this another 3 times and then to plot the averages and identify the tunnels by manually inserting repeated values for altitude in the tunnels (and under station canopies?).
 

OxtedL

Established Member
Associate Staff
Quizmaster
Joined
23 Mar 2011
Messages
2,631
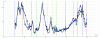
So to get an idea of how reliable the data was I've plotted the return journey in blue on the same graph. You'll have to refer to the old one for the labels, sorry, but it is fairly non-impressive data :D. In particular I notice that during the time the train it spent in Newcastle (slightly over an hour), Newcastle rose more than 30 <units?> relative to the sea... :p

I'll be keeping my eye on it certainly, and I'll try and get as much data together as possible. In particular I'll try your Northings+Eastings thing and see if I can get consistent distance readings for the whole route.

Fortunately I already know where the tunnels must be, as at these locations the data feed reports being able to see 0 satellites, as opposed to the usual 6 to 10.
 

Attachments

  • ECML2.gif
    ECML2.gif
    48.3 KB · Views: 20
Last edited:

DaveNewcastle

Established Member
Joined
21 Dec 2007
Messages
7,387
Location
Newcastle (unless I'm out)
Thanks for that, but it throws up more questions than answers, doesn't it?
The differences between the 2 journeys seems innexplicable.

The highest point between Durham and Darlington is, I think, at Tursdale Jn (just nth of Ferryhill) at 80mtrs.
The first, green, trace is close (being slightly high as all the readings are), but on the return it has climbed to 108mtrs!

Conversely, the lower altitudes between Newark and the M18 bridge sth of Donny appear to be much more accurate in the second blue trace, scraping along the plain of the Idle River near Bawtry and the Daneshill Lakes at about 8mtrs, and again through the Trent's plain near Cromwell and Muskham at about 10mtrs.

What can be the cause of such wide variations?
 
Last edited:

dbrb2

Member
Joined
29 May 2011
Messages
50
Altitude measurements from GPS are often far more variable than position. A more accurate measure of altitude might be via barometric pressure - but this may not be a feature of the kit.

It might be interesting to correlate the number of satellites on which a fix has been obtained (available from the data feed) against the variability of the altitude data.

One might see that in areas of dodgy GPS reception, fewer satellites are in view, and there is greater variability in recorded height.
 

DaveNewcastle

Established Member
Joined
21 Dec 2007
Messages
7,387
Location
Newcastle (unless I'm out)
Altitude measurements from GPS are often far more variable than position. . . . .
. . . . One might see that in areas of dodgy GPS reception, fewer satellites are in view, and there is greater variability in recorded height.
I didn't know that, thanks.
That could explain some variations between repeat journeys.

But does it explain the persistent differences (in OxtedL's graph of two journeys superimposed) where the error differential is sustained over a period of perhaps 20 minutes and in areas of exceptionally open countryside (such as the Trent & Idle Valleys), or the error of 30 meters between Stevenage and Huntingdon? Would the sat coverage at a low level result in an error which is repeated and sustained in this way?

(Or should I just go and dig out old Railway Maps of gradients?)
 
Last edited:

OxtedL

Established Member
Associate Staff
Quizmaster
Joined
23 Mar 2011
Messages
2,631
I've had a flick through the satellites data, and whilst there is no obvious difference in the number of satellites picked up generally (mean 9.58ish on the way north, 9.42 on the way back), the section between Stevenage and Huntingdon was typically 7 satellites when northbound and 9 or 10 southbound, giving significant weight to what dbrb2 is saying. If it is solely this, then it really does make a scary difference how many satellites you can 'see'.

The readings in stations however are just completely screwed (no better way of putting it). At one point this afternoon Kings Cross was 20m below sea level, with 9 satellites, despite being 40m above just 5 minutes earlier. This kind of explains the drifting from side to side we see when the train is at terminii - GPS really doesn't seem to like buildings.
 

DaveNewcastle

Established Member
Joined
21 Dec 2007
Messages
7,387
Location
Newcastle (unless I'm out)
GPS really doesn't seem to like buildings.
I think that is something we must just accept, particularly in terms of altitude.
Accept it and simply disregard the data when under canopies, bridges and of course tunnels.

But I'm even more puzzled by your findings that the number of aquired sat fixes in the exposed open areas were high numbers (the wide open plains for Lincs. & Notts.).
The variations between the two superimposed graphs are quite alarming with an error of up to 30mtrs sustained over tens of miles.

Do we know where (vertically) the RF receiving antenna is placed? I might guess that its been incorporated into the DVT's Wi-Fi dome, which surely adds about 3mtrs to altitude?

As a side note, I'm impressed that any RF reception equipment up there maintains enough immunity to the H.V. A.C. in the overheads to achieve any degree of reliability!
 

OxtedL

Established Member
Associate Staff
Quizmaster
Joined
23 Mar 2011
Messages
2,631
It's all very interesting, yes...

I just managed to miss the entire section between Stevenage and Peterborough (by doing something else and forgetting to check that everything was ok) on this latest trip, so that one will have to wait a bit longer :oops:.
 

OxtedL

Established Member
Associate Staff
Quizmaster
Joined
23 Mar 2011
Messages
2,631
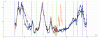
One more go for the hell of it then...
 

Attachments

  • ECML3.gif
    ECML3.gif
    56.7 KB · Views: 30

OxtedL

Established Member
Associate Staff
Quizmaster
Joined
23 Mar 2011
Messages
2,631
Anyone willing to guess what's going on with the set? I can't find it on live departures, it's looking very much like it might have just done London to Newcastle ECS! Please help. :D
 
Status
Not open for further replies.

Top