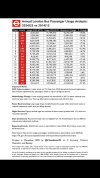
2024/25 top 20 TfL bus routes.
Interesting stats albeit somewhat unreliable due to some major route changes, methodology change and the cyber incident.
Annual London Bus Passenger Usage Analysis:
2024/25 vs 2014/15
| Rank | Route | Usage 2024/25 | Usage (2014/15) | Absolute change | % change |
| 1 | 18 | 12,102,221 | 17,744,870 | -5,642,649 | - 31.8% |
| 2 | 149 | 11,915,86l | 14,902,062 | -2,986,201 | -20.0% |
| 3 | 29 | 11,309,271 | 16,540,63l | -5,231,360 | -31.6% |
| 4 | 207 | 10,362,918 | 12,598,583 | -2,235,665 | -17.7% |
| 5 | 86 | 10,103,600 | 12,201,41l | -2,097,811 | -17.2% |
| 6 | 5 | 10,075,376 | 12,543,269 | -2,467,893 | -19.7% |
| 7 | 243 | 9,863,699 | 12,883,271 | -3,019,572 | -23.4% |
| 8 | 279 | 9,739,228 | 11,620,548 | -1,881,320 | -16.2% |
| 9 | 36 | 9,733,492 | 10,723,126 | -989,634 | -9.2% |
| 10 | 109 | 9,618,101 | 10,437,699 | -819,598 | -7.9% |
| 11 | 35 | 9,599,774 | 8,177,443 | +1,422,33l | +17.4% |
| 12 | 25 | 9,305,724 | 22,837,457 | -13,53l,733 | -59.3% |
| 13 | 53 | 9,062,642 | 10,795,860 | -1,733,218 | -16.1% |
| 14 | 141 | 8,967,528 | 10,007,475 | -1,039,947 | -10.4% |
| 15 | 38 | 8,579,455 | 13,232,007 | -4,652,552 | - 35.2% |
| 16 | 55 | 8,472,762 | 8,593,630 | -120,868 | -1.4% |
| 17 | 158 | 8,399,284 | 6,553,770 | +1,845,514 | +28.2% |
| 18 | 182 | 8,328,205 | 8,624,382 | -296,177 | -3.4% |
| 19 | 140 | 8,289,348 | 11,617,850 | -3,328,502 | -28.6% |
| 20 | 43 | 8,261,129 | 11,395,687 | -3,134,558 | -27.5% |
Important Notes:
2024 Cyber Incident: A cyber-attack on TfL (Sept-Nov 2024) disrupted photocard applications.
Data includes adjustments for passengers unable to 'tap in' during this period.
Methodology Change: A new tracking method was introduced in 2017 to better estimate 'non-touch-ins' (e.g. under-Ils). This may affect direct comparisons with 2014/15 data.
Route Restructuring: Large usage drops (notably Route 25) usually reflect shortened routes or reduced frequencies rather than just falling demand.
Night Services: Figures exclude night bus versions of these routes (prefixed with "N'), which are recorded separately.
Data Consistency: Route-level totals may vary slightly from TfL Annual Reports due to different network-level adjustment methods.
Reporting Periods: 2024/25 data covers 6 April 2024 to 4 April 2025; 2014/15 data covers that full financial year.
Data Source: Bus service usage: passengers and kilometres operated by route 2024/25
Network performance statistics and customer feedback can tell us a lot about how well our bus services are operating - and what we can do to improve them

TfL.gov.uk
Created in December 2025 by @CLondoner92on on (formerly Twitter).
Mastodon, and Bluesky.
The Transport for London (TfL) roundel shown in this resource is used for illustration purposes only. No affiliation. endorsement, or approval by Transport for London or any other public body is intended or implied.
Use of the roundel is considered to fall under the UK copyright exception for fair dealing, as outlined in Sections 30 and 32 of the Copyright. Designs and Patents Act 1988 (CDPA), which permits limited use for purposes such as illustration, commentary, or reporting. provided the use is fair, non-commercial, and sufficiently acknowledged where appropriate.
Link to original x post