
pdeaves
Established Member
Part of the interim solution is class 175 introduction.so what will be interim solution?

Part of the interim solution is class 175 introduction.so what will be interim solution?
Assuming 16 vehicles are direct replacements for HST, leaves about 40 extra vehicles, which are added to fleet of around 900 vehicles (or about 4% extra)Part of the interim solution is class 175 introduction.
Which makes it all the more impressive that the overall market from Cambridge (if you include Cambridge North) seems to have grown by about 800,000. It'll be fascinating to watch the impact that Camb South has when it eventually opens!
Don’t think there’s any “might” about it - other than the fact that many of those commuter lines are themselves main lines.A "heat map" of (number of passengers) along each rail line would be interesting. You might not be able to derive it from this data though.
It might show some commuter lines being much busier than higher profile main lines.
Completely agree and with Corby now well over 500k, it should put to bed the various ideas around reducing Corby back to 1tph. However, looking at nearby stations, it feels like over the very long term, Corby could catch Harborough and Wellingborough that are both around 950k-1 million. Corby will be bigger than either, but economically has had rather more challenges so is coming from a lower basis.Another fantastic year for Corby where numbers are now up to 600,000, or roughly double the plateau that was reached before the introduction of EMR Connect. Wellingborough's numbers are also back to pre-Covid levels, suggesting that the fire and brimstone predictions when the Intercity calls were removed haven't come to pass!
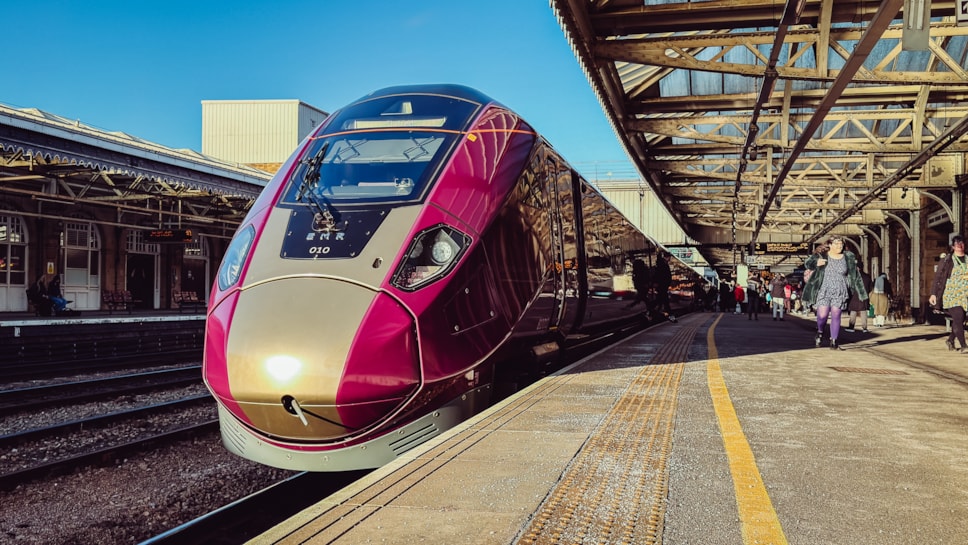
 news.eastmidlandsrailway.co.uk
Massive growth in South West, some examples from fabulous Jupp map and data
Examples of averaging growth per year over about 25 years
Pinhoe 16.25%
Clifton Down 9.19%
St Earth 9.00%
Worle 8.36%
St Ives 7.56%
Crediton 7.55%
Dawlish Warren 7.32%
Keynsham 6.72%
Cam and Dursley 6.15%
Falmouth Town 5.96%
Bridgewater 5.52%
Torre 5.47%
Frome 5.28%
Tiverton Parkway 5.22%
Par 5.11%
Barnstaple 4.96%
If these rates continue could be needing 30+% more capacity in 4-5 years, but project Churchward (or whatever it is formally now called) probably won't deliver until 6-7 years, so what will be interim solution?

Indeed. I compare with last year and the pandemic year (2019-2020 - we only really lost a fortnight of patronage in March 2020, but I know some people prefer the year before). Then, possibly, a 10-year comparison. Service levels and counting methodologies change so much it's not easy to divine a true trend.Be careful!
Many of these percentages are very misleading, not accurately reflecting recent growth and certainly not as a prediction of the future. Take a look at the graph of the data for St Ives for example. The gradient of the line of best fit, from which the average annual growth rate is deduced, is clearly affected by the poor figures pre 2011. If you draw the line of best fit by eye for the past 15 years, it is both far closer to all the points (so more likely to be an accurate reflection of growth over this period) and far less steep. Probably giving a far better estimate of around 1%.
I'd give a similar caveat for Clifton Down, though the high figure for Pinhoe holds true to my eye.
Yesterday I looked at the percentages of about 30 stations and found many nonsensical values, accurate mathematically but not useful as an accurate measure of recent growth. Take a look at Apperley Bridge for example, where the opening value, representing only a few weeks, shows the weakness of just accepting data without careful reflection.
I suppose Morpeth has quite a large catchment area, basically all the way up to Rothbury etc and much better long distance service now than it had over a decade ago. Also the fast services to Newcastle still make using Morpeth worthwhile rather than switching to Ashington.Ashington had 130,630 passengers; assuming that can be counted as a third of the year (it was slightly less than four months, but I'd guess the initial opening shortly before Christmas to have been busier than normal), that's around 400,000 entries and exits per year. I know the Northumberland line hasn't been struggling for passengers, but that's less than I'd have expected given that Redcar Central and Hexham are at that mark and Morpeth at 622,000 (up from 519,000, which I really wasn't expecting).
Overall numbers for Newcastle have gone up a lot though (8.82 mn in 2019-20 and 9.15 mn in 2023-24 to 10.55 mn; +20% / +15%), whilst Sheffield's up 9% from last year and only up 2% from 2019-20.
Wrexham is supposedly getting barriers in the foreseeable future, that will increase figures significantly (probably resulting in a reduction in the number of Bache-Chester tickets sold). There was talk of Llandudno Junction being done too.Perhaps the full introduction of the 197s has helped boost passenger numbers on the north Wales coast and Conwy Valley lines?
Assuming that the much improved north Wales coast timetable along with hourly Liverpool-Llandudno trains will actually be implemented in May 2026 then numbers should increase still further…?

As a regular visiter to Corby I'm convinced that the tiny car park is holding the station up from reaching its full potential. It would also be great if it could have proper toilets and a tenant found for the currently-closed refreshment stall.Another fantastic year for Corby where numbers are now up to 600,000, or roughly double the plateau that was reached before the introduction of EMR Connect. Wellingborough's numbers are also back to pre-Covid levels, suggesting that the fire and brimstone predictions when the Intercity calls were removed haven't come to pass!

In fact, there's some serious weirdness going on with those Northallerton figures, with full price tickets only making up 9.2% of all tickets sold.The "Interchanges" figure for Northallerton is shown as zero when there will quite clearly be a number occurring there...
I remember struggling to download it last year; railalefan.co.uk has the 100 most common flows from each station and railwaydata.co.uk has all of them, but I don't know how long it will be for 2024-25 data to be added.The individual station ORR data is very interesting and its great that it shows a big increase in most areas. Does anyone know if the individual passenger flows for a particular station are available and how we can access the information?

Just what I was thinking. Good to hear that Corby is doing so well regardless of the relentless groans of a few disgruntled commuters who not only dislike the 360s but were incensed that they still havent been refurbished & remain in 3+2 configuration.Another fantastic year for Corby where numbers are now up to 600,000, or roughly double the plateau that was reached before the introduction of EMR Connect. Wellingborough's numbers are also back to pre-Covid levels, suggesting that the fire and brimstone predictions when the Intercity calls were removed haven't come to pass!

St Albans is the only one of these that is a tourist destination. Easy day out from London. I’ve done it!
I believe you can get through tickets to Keswick on the bus. So it’s probably about right.As an opposite example, there were apparently two passengers changing at Penrith for every seven entering or exiting
Worcestershire parkway is probably top given it has 450,000 passengers a year and a population of ~0.With Crawley’s local borough population of 124,008 (as of 2021), Gatwick Airport has to be at the top with 21.2 million entries and exits!
And Waddeston from Aylesbury.Not Watford Junction for Harry Potter studios? Pretty sure that's a big draw!
Yep impressive growth. All the main stations on the line from Norwich (not sure about the halts) also seem to have seen big annual growth and above 2019 levels.Cambridge North has certainly been a success, despite still being pretty much in the middle of nowhere 8.5 years after opening. (They've literally only just managed to find someone to take on the 'shop' next to the entrance, although it has gone to a gym rather than retail). If/when they finally build more residental or commercial locations near the station, the figures presumably would increase ever more.
As pointed out, the figures around Cambridge (and Ely) will have been dented by endless weekend/holiday closures for Cambridge South, Cambridge resignalling, and the ECML signalling projects, that have gone on for the best part of three years now, with the third consecutive big Christmas closure coming up in a few weeks.
Again, be careful with raw statistics without their background! (see post 68).All the main stations on the line from Norwich (not sure about the halts) also seem to have seen big annual growth and above 2019 levels.
Wymondham had a dreadful service until Anglia Railways Cambridge service commenced in 2002. For example there was a 4 hour gap in westbound services during the middle of the day on Saturdays. The long distance Central trains serving it also had poor reliability.Again, be careful with raw statistics without their background! (see post 68).
If you are taking Tim Jupp's figures as gospel to indicate recent growth, you are being misled by many of them. For example look at Wymondham (8.72% average annual growth from 1998 to 2005). This is massively skewed by the very low usage before 2003. Look at his graph by clicking on the station. The dotted line of best fit gives his figure from its gradient. Try to draw a similar line through the last 15 years data only, or even just the 10 years pre covid. Both are much gentler, I estimate reflecting a growth of around 2%.

Although how much is that down to both split tickets (considering it's no longer a niche concept with Trainline selling them) and short farers by those from Cranbrook - Honiton gambling on the guard not being able to get to them due to the SDO stations.Examples of averaging growth per year over about 25 years
Pinhoe 16.25%
Pinhoe looks pretty genuine. Most trips are to Exeter and I am not sure where you’d be splitting the other way towards London?..
Although how much is that down to both split tickets (considering it's no longer a niche concept with Trainline selling them) and short farers by those from Cranbrook - Honiton gambling on the guard not being able to get to them due to the SDO stations.
As well as growth from all the housing in that area.
Do the reduced ones include off peak tickets? Because 68k anytime and 2 million off peak and advance might be right?Carlisle: 68,000 full price tickets, 2 million reduced price ones. Eh, I think not.
Unsurprisingly, outer commuter stations, at least northwest of London, are up from last year but still below 2019-20 (percentages of 2024-25).
2019-20 2023-24 2024-25 Watford Junction 8.44 mn (122%) 6.48 mn (93%) 6.94 mn Hemel Hempstead 1.89 mn (117%) 1.44 mn (89%) 1.61 mn St. Albans City 7.38 mn (111%) 6.32 mn (95%) 6.67 mn Bedford 3.87 mn (103%) 3.25 mn (86%) 3.76 mn Milton Keynes Central 6.94 mn (114%) 5.56 mn (91%) 6.10 mn Aylesbury 1.21 mn (134%) 0.85 mn (94%) 0.90 mn
The general trend's around eight journeys last year for every nine which were made in 2019-20, and around ten for every nine made in 2023-24.
I'd guess Bedford having fallen so little is due to EMR Connect having started, and Aylesbury due to Chiltern cuts (I could say people working at home, but I wouldn't expect St. Albans to be massively different there and that's had passenger numbers hold up better).
Is that what it means? I assumed that "reduced price" meant railcards/children etc.Do the reduced ones include off peak tickets? Because 68k anytime and 2 million off peak and advance might be right?

I would expect so. Reduced or ‘leisure’ tickets labelling reflects they would historically have been primarily used for non-business (assumed on full fare anytimes) or non-commuting (assumed on seasons). So LNER stations having primarily ‘reduced’ and somewhere where cheap day returns for local trips have been abolished like possibly Cardiff Queen St having primarily ‘full’ isn’t implausible.Do the reduced ones include off peak tickets? Because 68k anytime and 2 million off peak and advance might be right?
I noticed that the most popular destination from Carlisle is... Newcastle!Carlisle: 68,000 full price tickets, 2 million reduced price ones.
Newcastle: 604,000 full price tickets, nearly 10 million reduced price.
Eh, I think not.

