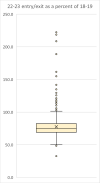
Attached is a box and whisker chart of 22-23 entry and exits as a percentage of 18-19, ie, the last full pre-pandemic year. I've removed new stations or those with data missing for any reason.
It shows a mean average of 77.5% use in 22-23 compared to 18-19. The mean is slightly higher than the median, and this is reflected in that there are more upper outliers than lower ones. The first and third quartiles are 69.1 to 82.4, meaning half the stations fall within those values, a quarter above and a quarter below.
The outliers at the top are mainly the Elizabeth Line and other London stations. I think that some had some re-calculations done, and others in London may be affected by new Elizabeth Line flows, though there are a few at the lower end of the outliers that it's harder to explain eg Metrocentre, Manea (could they reflect when ticket machines were installed?). Pollokshaws West is the largest outlier at the top that I know nothing about (129.6% use compared to 18-19).
Similarly at the bottom end, the outliers are mainly stations that form parts of group where there may have been recalcuations done - Canon Street, Moorgate. I presume that Lake was affected by the various closures on the Isle of Wight line. Does anyone know the story behind Oxford Road in Manchester - is that commuter changes, or something else? Ditto Snow Hill? My hunch is that they may be down to accounting rather than any real change.
The top ten increases are:
| Maryland | 222.3 |
| Manor Park | 218.7 |
| Farringdon | 208.5 |
| Abbey Wood | 188.9 |
| Forest Gate | 163.8 |
| Whitechapel | 161.7 |
| London Paddington | 155.0 |
| Southall | 141.8 |
| Queens Park (London) | 134.9 |
| Pollokshaws West | 129.6 |
The lowest percentage in 22-23 compared to 18-19.
| Rhymney | 51.3 |
| Rauceby | 51.3 |
| Balham | 51.3 |
| Old Hill | 50.7 |
| Birmingham Snow Hill | 50.7 |
| Bexleyheath | 50.1 |
| Manchester Oxford Road | 50.1 |
| Lake | 48.6 |
| Moorgate | 48.6 |
| London Cannon Street | 32.6 |