• Our new ticketing site is now live! Using either this or the original site (both powered by TrainSplit) helps support the running of the forum with every ticket purchase! Find out more and ask any questions/give us feedback in this thread!

ORR unveils station usage data between April 2022 and March 2023

Status
Not open for further replies.

wilbers

Member
Joined
10 Mar 2022
Messages
513
Location
Penrith
interesting that around here Langwathby has Leeds as main origin/destination station (6,656 out of 16,712), I guess there are only a handful of commuters into Carlisle from there and they are outweighed by people from Penrith-ish doing same as me every now and again heading down Leeds direction (I've never actually gone on the bit between Langwathby and Carlisle, I probably should one of these days even though its longer and a lot slower than just driving up the M6). On the same line Appleby (next station south) has main station Carlisle, and then the others towards Skipton are all Leeds (or Settle or Skipton).

My home station (Penrith) still down from c.600K pre-Covid to c.500K now.
 
Sponsor Post - registered members do not see these adverts; click here to register, or click here to log in
R

RailUK Forums

357

Established Member
Joined
12 Nov 2018
Messages
2,284
I don't think they can. When with some work colleagues we needed to get from a pub near Moorgate to an event being held near Tottenham Court Road. We went in through the Moorgate entrance, tapped in there and walked to the Elizabeth Line platform at Liverpool Street. They don't know if we caught the Elizabeth Line or if we took the Northern line down to Bank and changed there.
TfL get far more accurate passenger flow data than the mainline as their station wifi tracks phones and devices (even if not connected) to establish passenger flows. It was a known issue before the Elizabeth Line that there are multiple routes between the same tube stations.
 

yorksrob

Veteran Member
Joined
6 Aug 2009
Messages
44,414
Location
Yorks
You asked for a comparison with anticipated first year useage. I'm suggesting that much has changed since Reston was planned. Initial proposals tend to inflate ideas of usage, and be overoptimistic about delivery dates and costs- it's called 'optimism bias'. And this is encouraged indirectly in order to get approval and backing. We've also had Covid, reducing current expectations, and refocusing (whether anticipated or not) of journeys previously undertaken or expected in the locality may also be a factor. The frequency, timings and stopping patterns of trains are further considerations. Such matters are typical 'why?' questions. I think you recognise that it's not as straightforward as 'numbers are up', which suit media and political reports.
In short- sorry, I dont know the figures, and if as I suspect use of Reston is much lower than projected, they may not be easily found now. I genuinely wish you well.

No, initial proposals tend to underestimate usage - see Okehampton, Borders, Ebbw Vale etc.
 

dk1

Veteran Member
Joined
2 Oct 2009
Messages
19,887
Location
East Anglia
Looking at newish stations, also interesting to see that Soham is now 55,518 (although the previous statistics only covered 4 months) despite the 1tp2h service and that the biggest destination is Ely not Cambridge although only about a third of the total. I would have thought Cambridge would have had a plurality?

Yes that surprised me too as would’ve expected Cambridge to be the preferred destination. Was well used when I used that route the other week considering the 2-hourly frequency.
 

Killingworth

Established Member
Joined
30 May 2018
Messages
6,497
Location
Sheffield
Edale is an interesting station. Very few houses nearby it's numbers have been rising rapidly since Covid. Manchester is the main source. The other Hope Valley line stations are also doing well with Sheffield as the main source of incoming passengers. Grindleford's figures are down this year after a massive leap last year so there seems to have been some glitch there.
 

yorksrob

Veteran Member
Joined
6 Aug 2009
Messages
44,414
Location
Yorks
Edale is an interesting station. Very few houses nearby it's numbers have been rising rapidly since Covid. Manchester is the main source. The other Hope Valley line stations are also doing well with Sheffield as the main source of incoming passengers. Grindleford's figures are down this year after a massive leap last year so there seems to have been some glitch there.

Good walks, good pub - seems eminently explicable to me :)

Also, the gaps in the timetable seem to have been ironed out, which might help.
 

The Ham

Veteran Member
Joined
6 Jul 2012
Messages
12,040
Wasn’t Waterloo near 100m entries and exits pre pandemic?

No wonder the railway is losing so much money still.

To be fair Waterloo still saw a 39.5% rise in passenger numbers from the last set of data (41.4 million passed through the station between April 2021 and March 2022.).

You also have to remember that since April 2023 there's continued to be significant growth (maybe but as significant as 40% but still much higher than we'd typically expect from annual rail growth where 6% is a very strong year).

Certainly some of my rail trips have switched from going into Waterloo to going to Paddington - especially last weekend with the engineering works near Brookwood. For example it's cheaper for my family to drive to a Elizabeth Line station, pay for parking and get around London for the day and then get home again then it is to walk to my local station and get to and from Waterloo!!!
 

yorksrob

Veteran Member
Joined
6 Aug 2009
Messages
44,414
Location
Yorks
To be fair Waterloo still saw a 39.5% rise in passenger numbers from the last set of data (41.4 million passed through the station between April 2021 and March 2022.).

You also have to remember that since April 2023 there's continued to be significant growth (maybe but as significant as 40% but still much higher than we'd typically expect from annual rail growth where 6% is a very strong year).

Certainly some of my rail trips have switched from going into Waterloo to going to Paddington - especially last weekend with the engineering works near Brookwood. For example it's cheaper for my family to drive to a Elizabeth Line station, pay for parking and get around London for the day and then get home again then it is to walk to my local station and get to and from Waterloo!!!

Does this period cover the landslip at Hook as well ? That might have had a dampening effect.
 

hwl

Established Member
Joined
5 Feb 2012
Messages
8,289
I have the same puzzlement with Liverpool Street - up from 30m to 80m ?.
This is a very big increase to get just from one new line over the existing six tracks into Liverpool Street.

So what were Paddington and Liverpool Street like just before Covid - is it mostly down to a post Covid recovery ?.
If anything I would expect the Elizabeth line to have reduced entries and Exits at Paddington and Liverpool Street with people simply passing through.
This data covers a combined period when Crossrail core wasn't open, was full open and partially open with no through running at Paddington and Liverpool street. In the last case through passengers tapped out at the high level station and tapped back in at the low level station (and v/v) doubling the number of entries and exits for the interim no through running period.
ORR had to remove the double count from the Lennon data for the fully open era as it was hard code assumption by the DfT team that there was no through running that over stated total national rail use by several % (previously covered in other threads - e.g. Q1 2023-24 data having a revised baseline data for 2022-23). Hence ORR new preference for using TfL data directly where available as it is end to end not just gate to gate.
 

Killingworth

Established Member
Joined
30 May 2018
Messages
6,497
Location
Sheffield
Good walks, good pub - seems eminently explicable to me :)

Also, the gaps in the timetable seem to have been ironed out, which might help.

Indeed. Full hourly service stopping at all stations on the Hope Valley line didn't start until December 2022.

2023-4 figures will be better.
 

norbitonflyer

Established Member
Joined
24 Mar 2020
Messages
5,816
Location
SW London
Yes, 4 miles away Sheffield is the second most popular destination from Dore & Totley with a little over half as many passengers as Manchester Piccadilly, 38 miles away in the opposite direction! There's a better commuter service that way even with the appalling levels of service seen from TPE during the period of the stats.

Combined with WFM after effects of Covid that has reduced D&T figures back to where they were in 2017-18, still well below the high of 2019-20 but they're back on a healthy rising trajectory once again. Ridership out into the Peak District means most passengers at Dore are heading west. The bus from outside the station takes about 30 minutes into Sheffield, maybe if it turns up on time. The train takes 7 but only hourly. With a half hourly or better service Sheffield could rival Manchester for top spot.
Indeed, over short distances both frequency and proximity to your origin/destination will trump speed as the waiting time and the walk to and from the station/bus stop become more significant parts of the total journey time.
 

kristiang85

Established Member
Joined
23 Jan 2018
Messages
2,745
Waterloo falling down doesn't surprise me. With SWR being so unreliable and, more importantly, constantly short formed, there are many days when I plan to go into the office but just don't bother as the journey in looks horrendous. Judging by comments on an SWR passenger group I'm on, many people are similar.
 

railfan99

Established Member
Joined
14 Jun 2020
Messages
1,961
Location
Victoria, Australia
Clapham Junction is now the most popular origin and destination for Waterloo, I assume before the pandemic, it would have been somewhere like Guildford?

Initially I was surprised that Clapham Junction was only the 16th busiest station, but presumably this (drop?) is due to the decline in usage of season tickets given what was the massive rise in working from home?

I was there on a September 2023 weekday at about 0900 hours. I thought it quiet compared to what I recalled of a visit in 2013 (although latter may have been at about 0830, so not an apples v apples comparison).
 

Meerkat

Established Member
Joined
14 Jul 2018
Messages
9,276
Do we know the pre-covid relative commuter profiles for Waterloo and Victoria compared to other London termini?
It is the wealthier, longer distance, commuters that are WFH more, and the period of these stats is before the real dragging back into the office began.
My friends who commute into Waterloo were going in as little as possible but their employers have since started to drag them in three days a week.
Also it could of course be that Paddington and Liverpool Street also dropped but the Lizzie boost has been even bigger than it initially looks.
 

yorksrob

Veteran Member
Joined
6 Aug 2009
Messages
44,414
Location
Yorks
Do we know the pre-covid relative commuter profiles for Waterloo and Victoria compared to other London termini?
It is the wealthier, longer distance, commuters that are WFH more, and the period of these stats is before the real dragging back into the office began.
My friends who commute into Waterloo were going in as little as possible but their employers have since started to drag them in three days a week.
Also it could of course be that Paddington and Liverpool Street also dropped but the Lizzie boost has been even bigger than it initially looks.

I think it used to be Waterloo at the top with Victoria second pre-covid.

Victoria's inner-suburban network seems to be more heavily infiltrated with LU, Thameslink and LO, which could explain it slipping further than Waterloo.
 

Meerkat

Established Member
Joined
14 Jul 2018
Messages
9,276
Looking at newish stations, also interesting to see that Soham is now 55,518 (although the previous statistics only covered 4 months) despite the 1tp2h service and that the biggest destination is Ely not Cambridge although only about a third of the total. I would have thought Cambridge would have had a plurality?
Cambridge might be the nearest big city but Ely is a decent size place, in terms of shopping and entertainment. Would there be school/college traffic?
If Soham is being used just to get to Ely then sounds like they have used a load of cash and capacity to replace the bus....

== Doublepost prevention - post automatically merged: ==

I think it used to be Waterloo at the top with Victoria second pre-covid.
I was thinking in terms of the passenger profiles - distance and earnings (possibly shown by First Class usage??)
 

norbitonflyer

Established Member
Joined
24 Mar 2020
Messages
5,816
Location
SW London
Initially I was surprised that Clapham Junction was only the 16th busiest station, but presumably this (drop?) is due to the decline in usage of season tickets given what was the massive rise in working from home?

I was there on a September 2023 weekday at about 0900 hours. I thought it quiet compared to what I recalled of a visit in 2013 (although latter may have been at about 0830, so not an apples v apples comparison).
Ther figures cover entries and exits. Most users of Clapham Junction are interchanging.
 

railfan99

Established Member
Joined
14 Jun 2020
Messages
1,961
Location
Victoria, Australia
To a foreigner from a nation with a fairly low overall population, it's amazing that Norwich with about 1.98 million boardings and more than 200,000 changing trains for the 12 month period covered was only ranked #112 in patronage.

It's a busy station, as I have experienced in two successive Septembers.

Overall while you locals will have criticisms, the amount of published data is very good. It'll be fascinating to see if the upward trend in usage continues: whether WFH further reduces may be a major factor.
 

InkyScrolls

On Moderation
Joined
20 Jul 2022
Messages
1,461
Location
North of England

Genuinely interested if anyone on this Forum was one of the two people who went to Teeside Airport during the time period. Berney Arms is absent from the bottom five. Leeds and Manchester (Picc) being in the top stations out of London further amplifies the need for more capacity on the TPE route in terms of carriages and service frequency.
I was one of the two!

Though I didn't come from Crewe.
 
Last edited:

yorksrob

Veteran Member
Joined
6 Aug 2009
Messages
44,414
Location
Yorks
To a foreigner from a nation with a fairly low overall population, it's amazing that Norwich with about 1.98 million boardings and more than 200,000 changing trains for the 12 month period covered was only ranked #112 in patronage.

It's a busy station, as I have experienced in two successive Septembers.

Overall while you locals will have criticisms, the amount of published data is very good. It'll be fascinating to see if the upward trend in usage continues: whether WFH further reduces may be a major factor.

I can't imagine WFH increasing much further in the near future. Employers seem to be finding their natural comfort level with it now.

The biggest threats seem to be the crumbling edge of quality (to quote PP) and in the slightly longer term AI/automation.
 

cuccir

Established Member
Joined
18 Nov 2009
Messages
3,695
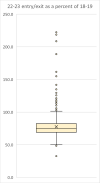
Attached is a box and whisker chart of 22-23 entry and exits as a percentage of 18-19, ie, the last full pre-pandemic year. I've removed new stations or those with data missing for any reason.

It shows a mean average of 77.5% use in 22-23 compared to 18-19. The mean is slightly higher than the median, and this is reflected in that there are more upper outliers than lower ones. The first and third quartiles are 69.1 to 82.4, meaning half the stations fall within those values, a quarter above and a quarter below.

The outliers at the top are mainly the Elizabeth Line and other London stations. I think that some had some re-calculations done, and others in London may be affected by new Elizabeth Line flows, though there are a few at the lower end of the outliers that it's harder to explain eg Metrocentre, Manea (could they reflect when ticket machines were installed?). Pollokshaws West is the largest outlier at the top that I know nothing about (129.6% use compared to 18-19).

Similarly at the bottom end, the outliers are mainly stations that form parts of group where there may have been recalcuations done - Canon Street, Moorgate. I presume that Lake was affected by the various closures on the Isle of Wight line. Does anyone know the story behind Oxford Road in Manchester - is that commuter changes, or something else? Ditto Snow Hill? My hunch is that they may be down to accounting rather than any real change.

The top ten increases are:

Maryland
222.3​
Manor Park
218.7​
Farringdon
208.5​
Abbey Wood
188.9​
Forest Gate
163.8​
Whitechapel
161.7​
London Paddington
155.0​
Southall
141.8​
Queens Park (London)
134.9​
Pollokshaws West
129.6​

The lowest percentage in 22-23 compared to 18-19.

Rhymney
51.3​
Rauceby
51.3​
Balham
51.3​
Old Hill
50.7​
Birmingham Snow Hill
50.7​
Bexleyheath
50.1​
Manchester Oxford Road
50.1​
Lake
48.6​
Moorgate
48.6​
London Cannon Street
32.6​
 

Attachments

  • 22-23 entry and exit as percent of 18-19.png
    22-23 entry and exit as percent of 18-19.png
    18.5 KB · Views: 61

dk1

Veteran Member
Joined
2 Oct 2009
Messages
19,887
Location
East Anglia
Overall while you locals will have criticisms, the amount of published data is very good. It'll be fascinating to see if the upward trend in usage continues: whether WFH further reduces may be a major factor.
WFH doesn't to seem so much of an issue anymore as has settled down with many employees doing extra days each week. Mondays have certainly picked up which is good to see.
 

Richardr

Member
Joined
2 Jun 2009
Messages
649
This data covers a combined period when Crossrail core wasn't open, was full open and partially open with no through running at Paddington and Liverpool street. In the last case through passengers tapped out at the high level station and tapped back in at the low level station (and v/v) doubling the number of entries and exits for the interim no through running period.
ORR had to remove the double count from the Lennon data for the fully open era as it was hard code assumption by the DfT team that there was no through running that over stated total national rail use by several % (previously covered in other threads - e.g. Q1 2023-24 data having a revised baseline data for 2022-23). Hence ORR new preference for using TfL data directly where available as it is end to end not just gate to gate.
How does that work when one is changing between, say, the Elizabeth Line and another rail service?

Take Farringdon. That is shown as 31.5 million entries and exits, with just 640,172 interchanges. Whilst it states that the interchanges doesn't include those to the Elizabeth Line from Thameslink and vice versa, does anyone who does interchange there count as an exit and an entry?
 

PGAT

Established Member
Joined
13 Apr 2022
Messages
2,133
Location
Selhurst
Attached is a box and whisker chart of 22-23 entry and exits as a percentage of 18-19, ie, the last full pre-pandemic year. I've removed new stations or those with data missing for any reason.

It shows a mean average of 77.5% use in 22-23 compared to 18-19. The mean is slightly higher than the median, and this is reflected in that there are more upper outliers than lower ones. The first and third quartiles are 69.1 to 82.4, meaning half the stations fall within those values, a quarter above and a quarter below.

The outliers at the top are mainly the Elizabeth Line and other London stations. I think that some had some re-calculations done, and others in London may be affected by new Elizabeth Line flows, though there are a few at the lower end of the outliers that it's harder to explain eg Metrocentre, Manea (could they reflect when ticket machines were installed?). Pollokshaws West is the largest outlier at the top that I know nothing about (129.6% use compared to 18-19).

Similarly at the bottom end, the outliers are mainly stations that form parts of group where there may have been recalcuations done - Canon Street, Moorgate. I presume that Lake was affected by the various closures on the Isle of Wight line. Does anyone know the story behind Oxford Road in Manchester - is that commuter changes, or something else? Ditto Snow Hill? My hunch is that they may be down to accounting rather than any real change.

The top ten increases are:

Maryland
222.3​
Manor Park
218.7​
Farringdon
208.5​
Abbey Wood
188.9​
Forest Gate
163.8​
Whitechapel
161.7​
London Paddington
155.0​
Southall
141.8​
Queens Park (London)
134.9​
Pollokshaws West
129.6​

The lowest percentage in 22-23 compared to 18-19.

Rhymney
51.3​
Rauceby
51.3​
Balham
51.3​
Old Hill
50.7​
Birmingham Snow Hill
50.7​
Bexleyheath
50.1​
Manchester Oxford Road
50.1​
Lake
48.6​
Moorgate
48.6​
London Cannon Street
32.6​
Acton Main Line is 253.7%
 
Status
Not open for further replies.

Top