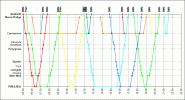
Often known as string diagrams or charts. I've created some simple ones rather laboriously in excel before. I graphed distance against time in a scatter plot. I created a standard timing column for each service type with times offset by sequential point to point and waiting times from a start time, then copied and pasted it across a table for the time period I wished to illustrate. Then I inserted start times for each train at the top and the rest of the times were generated. I graphed the result then spent ages tweaking the appearance! I remember in Excel I could interactively move the paths forwards and backwards in time on the chart and the table updated accordingly, but that doesn't seem to work in Libreoffice. There's dedicated professional software products clearly but I've no experience of them and expect they're rather expensive.
There's a member here who developed a simple windows programme that can create a timetable graph from a table. See this thread:
We at the Bedwyn Trains Passenger Group regularly put forward timetable suggestions to GWR. To help with this I've written a train graphing product for Windows. It's free to use. The user guide and free Windows download are available at https://steve09478.wixsite.com/mysite/tgsmith The user...

www.railforums.co.uk
Have just tried it. You can enter data as .csv in a spreadsheet.
Here's some output from a test file:
View attachment 182168