freetoview33
Established Member
Where can you find the website that lists stations and the 100 most popular destinations for the year?
Tia
Tia


Railwaydata.co.uk does it in a good way.Where can you find the website that lists stations and the 100 most popular destinations for the year?
Tia
There is a spreadsheet that is available on the ORR website where you can see the current annual station usage statistics:Where can you find the website that lists stations and the 100 most popular destinations for the year?
Tia
The starting point is the Office for Rail and Road, they publish the data.Where can you find the website that lists stations and the 100 most popular destinations for the year?
Tia
Estimates of station usage

Annual estimates of the number of entries/exits and interchanges at each station in Great Britain. These estimates are based primarily on ticket sales and are produced by Steer on behalf of ORR. For details on how these statistics are compiled, please see our Estimates of station usage quality and methodology report. We have also produced a list of frequently asked questions. For any information on revisions, please see our Revisions log.
Data and reports that include previous statistical releases on Estimates of station usage can be found on the National Archives.
Our statistical practice is regulated by the Office for Statistics Regulation (OSR).
If you require the published tables in an alternative file format or have any questions or feedback on these statistics, please contact rail.stats@orr.gov.uk
The origin destination matrix (ODM) that underpins our Estimates of station usage data is now freely available on the Rail Data Marketplace.
I use railway data for quick access to the detailed station to station flows. I quote numbers from here quite frequently in my contributions to this forum.Railwaydata.co.uk does it in a good way.
See: https://www.railwaydata.co.uk/flows/gbr/
They have all sorts on there so if you want any regional system data it might be there.
Last year the ORR published the station usage numbers and the Origin Destination Matrix a day apart. This year the station usage numbers is slated for November again, but no confirmed date. Hopefully that means the Origin Destination Matrix with station to station flows would come out in November again this year as well.I use railway data for quick access to the detailed station to station flows. I quote numbers from here quite frequently in my contributions to this forum.
Does anyone know when the 2024/25 data is due to be published?
Does anyone know if this exists?Are there any 'live' maps of freight movements similar to www.map.signalbox.io (or one that shows both)?

https://raildar.co.uk/radar.html shows freight and passenger services, I can't seem to find any freight right now, but I've definitely seen freight on the old version (https://raildar.co.uk/map/MAN).Does anyone know if this exists?
The surge in rail traffic to seaside towns, particularly in regions like the North East, South East, and East Anglia, has sparked a significant boost in local economies, with millions spent on local goods and services.

 www.travelandtourworld.com
The source of this data isn't very clear, and it will be a while before it can be corroborated by the ORR data.Occasionally other rail data comes out, such as Rail delivery Group advising tourist media of this summers growth of rail travel to seaside.
25% growth in North East, compared to previous year June 2024
32% growth in South East
18% growth in East Anglia

you can also see freight on Traksy, OpenTrainTime, Signalmaps.com, et al although they're not geographically faithful if that is what you were after.Does anyone know if this exists?
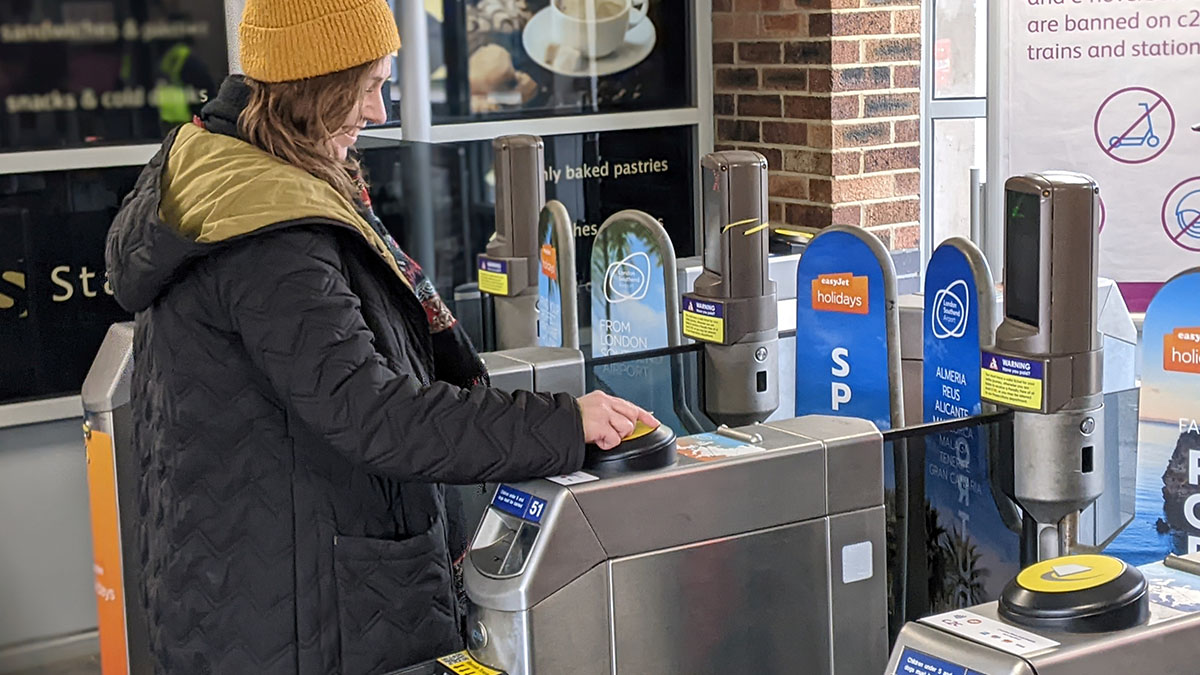
Local rail operator c2c Railway has seen a robust resurgence in commuter travel following the launch of Pay as you Go with contactless ticketing across the entire line in February 2025.
Despite modern working from home trends, c2c passenger volumes have recovered to over 80% of pre-2020 levels, while commuter habits have evolved significantly. Season tickets, which accounted for over 40% of c2c journeys in 2019, now represent circa 15%.
Eleni Jordan, c2c Commercial and Interim Customer Director
Instead, passengers are opting for the flexibility off-peak daily tickets, reflecting the shift in working patterns in the UK. Mondays and Fridays continue to grow year-on-year, with in-peak journeys across the week growing at around 5% in 2024/25.
In February, c2c became the first railway operator to offer pay as you go (PAYG/contactless) across its entire network in the UK, simplifying customer journeys and offering a more seamless way to travel. The expansion of PAYG has seen over 60,000 additional contactless taps each week.
Eleni Jordan, c2c Commercial and Interim Customer Director, said: “We launched PAYG with contactless ticketing in February 2025 and it has been incredibly successful with over one million taps since the launch.
“It provides our customers with another seamless way of using the c2c route, by simply tapping in and tapping out. This provides an easy-to-use solution which offers speed and convenience for every journey – with c2c seeing over 60,000 additional contactless taps each week as a result.
“We realised the challenges of 2025 are different to those that existed before 2020, which is why we have had to evolve to a new way of thinking and embrace the change in customer needs,” she added.
As of July, c2c has recorded over 1,000,000 taps across the line and has added another level in the ease of making a c2c journey. Today, c2c plays a central role in helping millions of commuters from south Essex and east London reach their workplaces every year.
 railuk.com
That's a load of spin in that press release. 20% fewer passengers than in 2019 (without Covid you'd be expecting more than in 2019) and a 63% decrease in season ticket sales, the TOC's largest revenue generator.Report from C2C saying strong return to commuting.
Passengers now over 80% of pre 2020 levels
Season tickets down from over 40% to 15%
Peak journeys up 5% this year
c2c sees strong return to commuting - Rail UK
c2c sees strong return to commuting - Travel

Doesn’t that often mean that buying anytime tickets for 3-4 days is often similar to or more expensive than season tickets?That's a load of spin in that press release. 20% fewer passengers than in 2019 (without Covid you'd be expecting more than in 2019) and a 63% decrease in season ticket sales, the TOC's largest revenue generator.
If these are raw passenger numbers, it’s going to take much larger % rises outside of London to counterbalance losses of 15-20% on London commuter franchises. If it’s passenger km then good performances on longer distance operators will do the same thing much easier (can’t open the stats on my phone)Excluding storm weekend, usage is now only around 6-7% down on pre-covid, but we know some London are commuter operators are apparently down 15-20% which suggests some other operators are now consistently above 110% (maybe locally lot more) to make the average work.
Alternative, if a certain London operator is seeing a *very* large increase on passenger numbers because a rather important bit of it wasn't open until after COVID that would go some way to offsetting it.If these are raw passenger numbers, it’s going to take much larger % rises outside of London to counterbalance losses of 15-20% on London commuter franchises. If it’s passenger km then good performances on longer distance operators will do the same thing much easier (can’t open the stats on my phone)
I did wonder about that, was going to look at ORR quarterly figures, but not yet available, whereas last year April-June was published 3rd October, this year they seem to be holding back the numbers until end of October, then their publication schedule says following quarter will be 7 weeks later.If these are raw passenger numbers, it’s going to take much larger % rises outside of London to counterbalance losses of 15-20% on London commuter franchises. If it’s passenger km then good performances on longer distance operators will do the same thing much easier (can’t open the stats on my phone)
The figures that show a drop are excluding the Elizabeth Line, if that’s the operator you mean. The figures including it are also there…Alternative, if a certain London operator is seeing a *very* large increase on passenger numbers because a rather important bit of it wasn't open until after COVID that would go some way to offsetting it.
Yes it was EL. The figures including it are regularly c.10% higher recently than those excluding it. Suggests that EL is doing a fair bit of the heavy lifting.The figures that show a drop are excluding the Elizabeth Line, if that’s the operator you mean. The figures including it are also there…
Inevitable - particularly if it is raw passenger numbers rather than passenger kms.Yes it was EL. The figures including it are regularly c.10% higher recently than those excluding it. Suggests that EL is doing a fair bit of the heavy lifting.
The original intended date of publication was 2nd October which has been pushed back by 4 weeks. The stats function won't have much incentive to hide anything and from stats functions elsewhere there's roughly two camps for delays. For avoidance of doubt no knowledge of what the ORR team are doing and the below are just examples.I did wonder about that, was going to look at ORR quarterly figures, but not yet available, whereas last year April-June was published 3rd October, this year they seem to be holding back the numbers until end of October, then their publication schedule says following quarter will be 7 weeks later.
Not sure why ORR are publishing quarterly usage numbers by operator at such random intervals, my intrguied side thinks they are hiding something.
Thanks for posting this.ORR has released latest quarterly usage today 30th October
Table 1.1 operators showing increases from 2% to 15% on year ago
Table 2.2 passenger km increased for all operators with West Midlands highest at 19%
Table 4 train km and Table 5 show a few operators have cut their operations (even though passenger numbers up). Comparing percentage changes for table 4 and table 5 show some operators have cut average train length.
Lots of data by operator
Very true - but given the leap in the sale of advances hardly surprising. In that context a 1% lag is probably just "noise" unless repeated year after year. Ironically any "return to the office" may well exacerbate this trend - increasing the proportion of short-distance journeys made (even if they are at full fare)Thanks for posting this.
The headline for me is that while passenger journeys have increased by 7%, revenue has increased by 6%, so that's less revenue per passenger journey than the same time last year. That isn't great news when the government is intent on reducing subsidy to the railways. You really want revenue growth to be ahead of passenger journey growth, otherwise the railways are going to get to the position of needing to put on longer trains or increase services to cater for demand, but can't afford to do so.

