• Our new ticketing site is now live! Using either this or the original site (both powered by TrainSplit) helps support the running of the forum with every ticket purchase! Find out more and ask any questions/give us feedback in this thread!

ORR release quarterly passenger data

Status
Not open for further replies.

Krokodil

Established Member
Joined
23 Jan 2023
Messages
6,525
Location
Wales
I'm particularly surprised that Avanti grew so much as they are a Long Distance operator
From page 8:
Avanti West Coast and Transpennine Express ran reduced timetables in the previous year, which caused a large increase in passenger kilometres in the latest quarter, compared with the previous year (both up 39%).
 
Sponsor Post - registered members do not see these adverts; click here to register, or click here to log in
R

RailUK Forums

Nicholas Lewis

Established Member
Joined
9 Aug 2019
Messages
7,987
Location
Surrey
Latest data for last Quarter has been released.


All TOCs saw growth in passenger figures, with the Elizabeth Line (unsurprisingly) seeing the most growth at 40%, followed by Avanti at 38%, Scotrail at 34%, TPE at 33%, Lumo at 29%, Hull Trains at 27%, XC at 26%, EMR at 23%, GC at 22%, Cal Sleeper at 20%, LO at 20%, WMT (WMR and LNR) at 20%, TFW with 19%, Greater Anglia at 18%, Chiltern at 16%, SWR at 15%, Merseyrail at 15%, Northern at 14%, SE at 14%, GTR at 13%, GWR at 10%, LNER at 6%, C2C at 6% and Heathrow Express at 5%.

I'm particularly surprised that Avanti grew so much as they are a Long Distance operator, this indicates more growth in long distance leisure and business travel. HX growing also surprises me with EL coming online, but Heathrow as an airport saw an increase in passenger numbers so this means that more people are using both HX and EL.
Results are compared to previous 12mths on a qtr to qtr basis which is when Avanti were in a state of chaos with a vastly reduced timetable and probably same applies to TPE but the results are very good for other operators given the ongoing industrial action. However, Elizabeth line is such a big percentage of all trips it distorts meaningful comparisons with the past but you can look at individual operators in table 1223

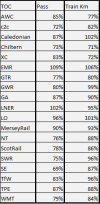
As they don't produce the table anymore by individual operator here is the main operators current position compared to Q4 2019

1711127486156.png

SE presumably impacted by Elizabeth Line and EMR was Connect service no doubt passenger abstraction from GTR.
 

J-2739

Established Member
Joined
30 Jul 2016
Messages
2,237
Location
London
Interesting to see that they have scaled back on the comparisons with pre-COVID figures; this seems to indicate that this is no longer a valuable metric of recovery, such has the time lapsed since it first hit our shores.
 

Snow1964

Established Member
Joined
7 Oct 2019
Messages
11,029
Location
West Wiltshire
When you start crunching the data in ORR tables 1223, 1233, 1243, 1253 you can see how things have changed

eg compared to 2019 (pre pandemic) get GWR at about 80% by passenger volume, but nearer 90% by passenger km (so travelling further). Get almost same number of train miles, but find vehicle km has fallen around 10%, as on average lost half a coach from every train.
 

Nicholas Lewis

Established Member
Joined
9 Aug 2019
Messages
7,987
Location
Surrey
When you start crunching the data in ORR tables 1223, 1233, 1243, 1253 you can see how things have changed

eg compared to 2019 (pre pandemic) get GWR at about 80% by passenger volume, but nearer 90% by passenger km (so travelling further). Get almost same number of train miles, but find vehicle km has fallen around 10%, as on average lost half a coach from every train.
Looking at train miles most operators have made reductions commensurate with reduced passengers yet GWR doesn't. Wonder why thats been allowed. Also GWR have the biggest draw on the public purse still albeit not when measured at subsidy per journey that is Northern.
 

Adrian1980uk

Member
Joined
24 May 2016
Messages
839
Results are compared to previous 12mths on a qtr to qtr basis which is when Avanti were in a state of chaos with a vastly reduced timetable and probably same applies to TPE but the results are very good for other operators given the ongoing industrial action. However, Elizabeth line is such a big percentage of all trips it distorts meaningful comparisons with the past but you can look at individual operators in table 1223

As they don't produce the table anymore by individual operator here is the main operators current position compared to Q4 2019

View attachment 154770

SE presumably impacted by Elizabeth Line and EMR was Connect service no doubt passenger abstraction from GTR.
So take GA running 90% train miles compared with 87% passengers... Relationship anyone? Cause or effect is the question, maybe when I get a free moment I'll compare some of the others
 

Nicholas Lewis

Established Member
Joined
9 Aug 2019
Messages
7,987
Location
Surrey
So take GA running 90% train miles compared with 87% passengers... Relationship anyone? Cause or effect is the question, maybe when I get a free moment I'll compare some of the others
1711140687366.png

There you go all compared to Q4 2019. This would suggest GWR and SWR haven't cut back sufficiently compared to other operators.
 

stuu

Established Member
Joined
2 Sep 2011
Messages
3,762
View attachment 154788

There you go all compared to Q4 2019. This would suggest GWR and SWR haven't cut back sufficiently compared to other operators.
GWR are only running 91% of their vehicle KM, so if they are running similar train KM, the average train is shorter. Same with SWR, they are only running 86% of previous vehicle KM
 

Snow1964

Established Member
Joined
7 Oct 2019
Messages
11,029
Location
West Wiltshire
For clarity here are the percentages of vehicle km operated
Oct-Dec 2024 as percentage of Oct-Dec 2019
percentage in brackets is vs Oct-Dec 2010 (earliest quarterly figure)

Elizabeth line 341.6% (n/a)
Transpennine Express 113.6% (160.2%)
Heathrow Express 112.7% (696%)
Grand Central 106.6% (112.6%)
London Overground 106.5% (281.1%)
East Midlands 103.4% (103.4%)
Transport for Wales 101.8% (103.0%)
Hull Trains 100.5% (125.4%)
West Midlands 98.3% (139.4%)
Merseyrail 97.0% (100.6%)
Greater Anglia 95.3% (101.2%)
Caledonian Sleeper 94.9% (n/a)
Chiltern Railway 94.9% (147.3%)
Northern Rail 94.7% (137.2%)
Scotrail 92.9% (131.5%)
South Eastern 92.6% (111.3%)
Great Western Railway 91.6% (103.9%)
South Western Rail 90.6% (97.3%)
C2C 88.1% (102.2%)
LNER 82.5% (94.2%)
Avanti West Coast 80.8% (96.7%)
Govia Thameslink 80.3% (135.4%)
Cross Country 79.6% (82.4%)

I have ranked them compared to 5 years ago, some operators are operating more km than pre pandemic, but others have cut back, with cross country over 20% less

I have also added comparison (in brackets) to earliest quarterly figures (2010) which gives a movement over 14 years. Nearly all operators are higher, although most long distance operators (Avanti, LNER, Cross Country) have cut back. The only regional or commuter operator to have cut in 14 years is SWR

I cannot work out why there is such inconsistency in changes of service levels between operators (bar the obvious ones like Overground and Elizabeth lines), maybe others can explain better.
 

The exile

Established Member
Joined
31 Mar 2010
Messages
9,309
Location
Somerset
There you go all compared to Q4 2019. This would suggest GWR and SWR haven't cut back sufficiently compared to other operators.
Tell that to the long-suffering passengers on Portsmouth - Cardiff, for example.

== Doublepost prevention - post automatically merged: ==

Looking at train miles most operators have made reductions commensurate with reduced passengers yet GWR doesn't. Wonder why thats been allowed. Also GWR have the biggest draw on the public purse still albeit not when measured at subsidy per journey that is Northern.
Unless the figures are for after the December 2019, they won’t include some of GWR’s cuts (the Bristol superfasts that caught COVID before really getting off the ground). At the same time, the Metro West project has added quite a lot of extra train km around Bristol - but will still be in the ramping up stage of passenger numbers.
 
Last edited:

Benjwri

Established Member
Joined
16 Jan 2022
Messages
3,270
Location
Bath
View attachment 154788

There you go all compared to Q4 2019. This would suggest GWR and SWR haven't cut back sufficiently compared to other operators.
Although are you not comparing Passenger numbers to train km, and therefore this direct link from passenger numbers to vehicle km is not quite as you suggest. In GWRs case I would suggest this represents a shifting demographic from commuting to more long distance journeys being taken, which is not accounted for in your stats, which compare a distance adjusted figure to one that isn't. Certainly with GWR no longer operating the stoppers from Didcot to London that they did in 2019, this will represent a fairly significant cut on short distance, and obviously the shift to WFH since 2019 a dn increased leisure travel will result in longer journeys.
 

Nicholas Lewis

Established Member
Joined
9 Aug 2019
Messages
7,987
Location
Surrey
Although are you not comparing Passenger numbers to train km, and therefore this direct link from passenger numbers to vehicle km is not quite as you suggest. In GWRs case I would suggest this represents a shifting demographic from commuting to more long distance journeys being taken, which is not accounted for in your stats, which compare a distance adjusted figure to one that isn't. Certainly with GWR no longer operating the stoppers from Didcot to London that they did in 2019, this will represent a fairly significant cut on short distance, and obviously the shift to WFH since 2019 a dn increased leisure travel will result in longer journeys.
Sadly ORR only publish operator wide stats and i would imagine GWR have also lost a level of passengers on the Reading to Paddington corridor to Lizzie line as well.
 

Snow1964

Established Member
Joined
7 Oct 2019
Messages
11,029
Location
West Wiltshire
Although are you not comparing Passenger numbers to train km, and therefore this direct link from passenger numbers to vehicle km is not quite as you suggest. In GWRs case I would suggest this represents a shifting demographic from commuting to more long distance journeys being taken, which is not accounted for in your stats, which compare a distance adjusted figure to one that isn't. Certainly with GWR no longer operating the stoppers from Didcot to London that they did in 2019, this will represent a fairly significant cut on short distance, and obviously the shift to WFH since 2019 a dn increased leisure travel will result in longer journeys.
Yes GWR is nearer 80% by passenger volume, but 91.6% by passenger km, so on average each passenger is travelling about 12% further.

If you do GWR passenger km, vs vehicle km, then you find they are more crowded because vehicle km has been cut more than passenger km.

The passenger km vs vehicle km ratio is worse than when they had decided to add the 769s, (and before cutting the castle HSTs, and losing some 387s, and a DMU). Or to rephrase it there is stronger case now for urgent extra stock than when they were getting it 5 years ago.

In very blunt terms they have shortened each train by average half a coach, but due to longer journeys have more passengers per vehicle per km.
 

Snow1964

Established Member
Joined
7 Oct 2019
Messages
11,029
Location
West Wiltshire
New ORR quarterly passenger data released 13th June 2024


Table 1 : 1.610m journeys, 16% up from 1,380m year ago

Figure 1.2 : all operators (except Heathrow Express) up on last year, varies by operator from 3% to 54%

Table 1.1 : season tickets fallen from 34% (in 2019-20) to 13%

Figure 1.3 is change in passenger journeys by Operator

Figure 2.1 change in passenger journeys, 14 operators were over 10% up on last year

Table 3.2 is average journey length by operator, Transpennine passengers travelling 48% further than previous year

Table 5.1 is passenger train km by operator, most up, but 2 have shrunk

Table 6.1 is vehicle km by operator (similar to table 5.1), but comparing the two shows average train formation, so can see which operators have lengthened or shortened trains


Split by Operator (biggest first) , Passenger km, vehicle km, passengers per vehicle

Govia Thameslink 1856m, 115m, 16.1
Avanti West Coast 1581m, 72.7m, 21.8
Great Western 1439m, 65.5m, 22.0
London NorthEastern 1394m, 47.6m, 29.8
South Western 1128m, 62.5m, 18.0
SouthEastern 888m, 59.6m, 14.9
Greater Anglia 834m, 51.8m, 20.7
Cross Country 728m, 28.4m, 25.6
Northern 692m, 36.9m, 18.7
West Midlands 636m, 33.9m, 18.8
East Midlands 608m, 28.0m, 21.7
Scotrail 590m, 45.8m, 12.9
Elizabeth Line 545m, 26.3m, 20.7
Transpennine 457m, 20.7m, 22.1
London Overground 309m, 13.1m, 23.6
Chiltern 273m, 9.1m, 30.0
TfW Rail 262m, 15.7m, 16.7
C2C 211m, 10.9m, 19.4
Lumo 144m, 2.5m, 58.0
Merseyrail 122m, 5.9m, 20.7
Grand central 116m 3.2m, 36.4
Hull trains 81m, 2.3m, 35.4
Caledonian sleeper 59m, 3.9m, 15.2
Heathrow Express 25m, 2.8m, 9.0

Lumo has busiest carriages at 58 people,
Heathrow Express only carries 9 per carriage (does that really justify using busy paths)
Chiltern carriages are more than twice as busy as South Eastern

Lots of interesting numbers that show that some reallocation of resource focus is needed

 
Last edited:

deltic

Established Member
Joined
8 Feb 2010
Messages
3,713
It is notable that Northern has higher passenger loadings per vehicle than Thameslink, South Eastern and South Western
 

The exile

Established Member
Joined
31 Mar 2010
Messages
9,309
Location
Somerset
It is notable that Northern has higher passenger loadings per vehicle than Thameslink, South Eastern and South Western
Quite apart from short trains, I imagine there is a lot less carting of fresh air around in the “wrong direction” at peak hours.
 

John R

Established Member
Joined
1 Jul 2013
Messages
6,066
Particularly pleased to see that for the latest quarter against a year ago Heathrow Express is down 12%, suggesting an acceleration of the impact of the Elizabeth Line.
 

FenMan

Established Member
Joined
13 Oct 2011
Messages
1,538
Interesting that LNER's plan to price passengers off its trains seems to be wroking.
 

ChrisC

Established Member
Joined
7 Oct 2018
Messages
2,251
Location
Nottinghamshire
It is notable that Northern has higher passenger loadings per vehicle than Thameslink, South Eastern and South Western
East Midlands has higher passenger loadings than Northern, and also slightly higher than Greater Anglia and West Midlands, despite still not having had any new stock. High loadings are probably as a result of trains running with an inadequate number of carriages on busy routes.
 

Nicholas Lewis

Established Member
Joined
9 Aug 2019
Messages
7,987
Location
Surrey
New ORR quarterly passenger data released 13th June 2024


Table 1 : 1.610m journeys, 16% up from 1,380m year ago

Figure 1.2 : all operators (except Heathrow Express) up on last year, varies by operator from 3% to 54%

Table 1.1 : season tickets fallen from 34% (in 2019-20) to 13%

Figure 1.3 is change in passenger journeys by Operator

Figure 2.1 change in passenger journeys, 14 operators were over 10% up on last year

Table 3.2 is average journey length by operator, Transpennine passengers travelling 48% further than previous year

Table 5.1 is passenger train km by operator, most up, but 2 have shrunk

Table 6.1 is vehicle km by operator (similar to table 5.1), but comparing the two shows average train formation, so can see which operators have lengthened or shortened trains


Split by Operator (biggest first) , Passenger km, vehicle km, passengers per vehicle

Govia Thameslink 1856m, 115m, 16.1
Avanti West Coast 1581m, 72.7m, 21.8
Great Western 1439m, 65.5m, 22.0
London NorthEastern 1394m, 47.6m, 29.8
South Western 1128m, 62.5m, 18.0
SouthEastern 888m, 59.6m, 14.9
Greater Anglia 834m, 51.8m, 20.7
Cross Country 728m, 28.4m, 25.6
Northern 692m, 36.9m, 18.7
West Midlands 636m, 33.9m, 18.8
East Midlands 608m, 28.0m, 21.7
Scotrail 590m, 45.8m, 12.9
Elizabeth Line 545m, 26.3m, 20.7
Transpennine 457m, 20.7m, 22.1
London Overground 309m, 13.1m, 23.6
Chiltern 273m, 9.1m, 30.0
TfW Rail 262m, 15.7m, 16.7
C2C 211m, 10.9m, 19.4
Lumo 144m, 2.5m, 58.0
Merseyrail 122m, 5.9m, 20.7
Grand central 116m 3.2m, 36.4
Hull trains 81m, 2.3m, 35.4
Caledonian sleeper 59m, 3.9m, 15.2
Heathrow Express 25m, 2.8m, 9.0

Lumo has busiest carriages at 58 people,
Heathrow Express only carries 9 per carriage (does that really justify using busy paths)
Chiltern carriages are more than twice as busy as South Eastern

Lots of interesting numbers that show that some reallocation of resource focus is needed
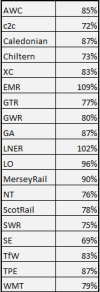
On a look back to 2019/20 GA are closest at 90% of the private operators and LNER at 108%. SE at 70% are worst of the OLR and C2C at 72% of the privateers. Hull Trains do the best amongst open access operators at 142%.

Looking at vehicle miles the biggest outlier looks to be Northern which is operating 108% of 19/20 mileage but only carrying 86% of the traffic. Presumably reflective of influx of 195s and 331s having more overall coaches than what was replaced.
 

YorkRailFan

Established Member
Joined
6 Sep 2023
Messages
3,265
Location
York
East Midlands has higher passenger loadings than Northern, and also slightly higher than Greater Anglia and West Midlands, despite still not having had any new stock. High loadings are probably as a result of trains running with an inadequate number of carriages on busy routes.
With TPE and XC beating EMR, unsurprisingly. Avanti also barely beats EMR.

Notably, OAOs have the highest passenger loadings which is unsurprising given low prices and low frequency.
 

philosopher

Established Member
Joined
23 Sep 2015
Messages
1,513
New ORR quarterly passenger data released 13th June 2024


Table 1 : 1.610m journeys, 16% up from 1,380m year ago

Figure 1.2 : all operators (except Heathrow Express) up on last year, varies by operator from 3% to 54%

Table 1.1 : season tickets fallen from 34% (in 2019-20) to 13%

Figure 1.3 is change in passenger journeys by Operator

Figure 2.1 change in passenger journeys, 14 operators were over 10% up on last year

Table 3.2 is average journey length by operator, Transpennine passengers travelling 48% further than previous year

Table 5.1 is passenger train km by operator, most up, but 2 have shrunk

Table 6.1 is vehicle km by operator (similar to table 5.1), but comparing the two shows average train formation, so can see which operators have lengthened or shortened trains


Split by Operator (biggest first) , Passenger km, vehicle km, passengers per vehicle

Govia Thameslink 1856m, 115m, 16.1
Avanti West Coast 1581m, 72.7m, 21.8
Great Western 1439m, 65.5m, 22.0
London NorthEastern 1394m, 47.6m, 29.8
South Western 1128m, 62.5m, 18.0
SouthEastern 888m, 59.6m, 14.9
Greater Anglia 834m, 51.8m, 20.7
Cross Country 728m, 28.4m, 25.6
Northern 692m, 36.9m, 18.7
West Midlands 636m, 33.9m, 18.8
East Midlands 608m, 28.0m, 21.7
Scotrail 590m, 45.8m, 12.9
Elizabeth Line 545m, 26.3m, 20.7
Transpennine 457m, 20.7m, 22.1
London Overground 309m, 13.1m, 23.6
Chiltern 273m, 9.1m, 30.0
TfW Rail 262m, 15.7m, 16.7
C2C 211m, 10.9m, 19.4
Lumo 144m, 2.5m, 58.0
Merseyrail 122m, 5.9m, 20.7
Grand central 116m 3.2m, 36.4
Hull trains 81m, 2.3m, 35.4
Caledonian sleeper 59m, 3.9m, 15.2
Heathrow Express 25m, 2.8m, 9.0

Lumo has busiest carriages at 58 people,
Heathrow Express only carries 9 per carriage (does that really justify using busy paths)
Chiltern carriages are more than twice as busy as South Eastern

Lots of interesting numbers that show that some reallocation of resource focus is needed
I am surprised CrossCounty Trains only have 26 passengers per carriage given all the complaints about overcrowding on this operator. I use Chiltern quite regularly, which has the highest passengers per carriage of the non open access operators and they rarely are overcrowded, in the sense that people are standing.
 

Adrian1980uk

Member
Joined
24 May 2016
Messages
839
I am surprised CrossCounty Trains only have 26 passengers per carriage given all the complaints about overcrowding on this operator. I use Chiltern quite regularly, which has the highest passengers per carriage of the non open access operators and they rarely are overcrowded, in the sense that people are standing.
Sums up the challenge most TOCs have, long trains are needed for 2 to 3 hours of peak services and then the run half empty through the day and the the long trains are need again for another couple of hours.
 

Goldfish62

Veteran Member
Joined
14 Feb 2010
Messages
13,123
Interesting to see that they have scaled back on the comparisons with pre-COVID figures; this seems to indicate that this is no longer a valuable metric of recovery, such has the time lapsed since it first hit our shores.
Not least because of the time lapse and the fact that without Covid there should have been ongoing annual passenger and revenue growth (the latter always required to counter the relentless increases in costs - Covid didn't stop these increasing).

For example, if 5% annual growth in passenger numbers was assumed then the baseline for this year would be 128% of the 2019 numbers.
 

Snow1964

Established Member
Joined
7 Oct 2019
Messages
11,029
Location
West Wiltshire
I am surprised CrossCounty Trains only have 26 passengers per carriage given all the complaints about overcrowding on this operator. I use Chiltern quite regularly, which has the highest passengers per carriage of the non open access operators and they rarely are overcrowded, in the sense that people are standing.
That's problems with averages, it can mask big short term variations.

Thats why in the past I suggested cross country reform the voyager fleet into 6 car and 3car all standard class crowdbuster units with extra units used to lengthen trains on busy sections Bristol-Sheffield and Reading-Wolverhampton etc (3car never used on their own). Even if you don't do this, the lack of adding and removing extra units to strengthen the busy central section is part of XCs problem. In theory with their 5-10 minute waits at Reading & Bristol etc, there is plenty of time to do this. Instead XC persist with some 4car only units in Midlands that are badly overcrowded, and running some 9car formations to quiet fringes of their routes
 

Benjwri

Established Member
Joined
16 Jan 2022
Messages
3,270
Location
Bath
In theory with their 5-10 minute waits at Reading & Bristol etc, there is plenty of time to do this.
Bristol could be possible, I’m doubtful about Reading. Obviously a decent amount of the allowance is for reversing, but also imo there just isn’t space. What do you do with the left over unit between services? There isn’t a depot or siding to run it to without trapping crew until the train comes back in and you can’t leave it in the platform.
 

Snow1964

Established Member
Joined
7 Oct 2019
Messages
11,029
Location
West Wiltshire
I am surprised CrossCounty Trains only have 26 passengers per carriage given all the complaints about overcrowding on this operator. I use Chiltern quite regularly, which has the highest passengers per carriage of the non open access operators and they rarely are overcrowded, in the sense that people are standing.
Extracted the XC passenger figures from ORR data
Latest Jan-March 2024 and for comparison 2019 (5 years ago pre pandemic). and 2014 (10 years ago)

Passenger Journeys : 2014 8.22m, 2019 10.12m, 2024 8.74m
XC Journey Km : 2014 756m, 2019 916m, 2024 728m
Average journey length : 2014 91.9km, 2019 90.5km, 2024 83.3km

So XC passenger km is just 4% down on 10 years ago, but 20% down on 5 years ago

I suspect if average passenger is travelling 52 miles on XC then it is those doing short hops on XC trains that is causing localised crowding
 

Goldfish62

Veteran Member
Joined
14 Feb 2010
Messages
13,123
View attachment 154788

There you go all compared to Q4 2019. This would suggest GWR and SWR haven't cut back sufficiently compared to other operators.
SWR was significantly impacted by strike action in Q4 2019, which reduced scheduled Km and also resulted in the Dec 2019 timetable, which included various enhancements, being deferred until January. This only lasted a couple of months before Covid started having an impact and services were reduced prior to the first lockdown.
 

The Ham

Veteran Member
Joined
6 Jul 2012
Messages
12,021
Not least because of the time lapse and the fact that without Covid there should have been ongoing annual passenger and revenue growth (the latter always required to counter the relentless increases in costs - Covid didn't stop these increasing).

For example, if 5% annual growth in passenger numbers was assumed then the baseline for this year would be 128% of the 2019 numbers.

In the run up to COVID annual growth was slowing, so whilst XC saw 2015/16 growth of 5.05%, the following year was 4.02% then 3.69% and by 2018/19 it has reduced to 1.22%.

If we assumed a growth of 2.5% then for every 100 in 2019/20 by 2024/25 it would be 113 passengers. However other things would likely have been different from now.

For example, would the HST's still be at XC? That would make a difference on the number passengers who could travel in comfort, and so it could well be that XC could have better coped with a higher than 2018/19 for.

There's probably a fairly good chance that without COVID that XC would have seen new rolling stock at a franchise renewal. New trains would likely have resulted in extra passengers.

Whilst we are still below pre COVID numbers between 2022/23 and 2023/24 the annual growth rate was 18%, if we assume that this halves every year (so 9%, 4.5% and then 2.5%) we'd go from 100 in 2018/19 to 80 in 2023/24 to 87 in 2024/25, 91 in 2025/26 and 93 in 2026/27.

However, if the next party in power fixes the strikes then we could easily see much higher rates of growth.

Pair that with some investment in rail and it's not impossible for rail to catch back to with the lost years.
 
Status
Not open for further replies.

Top